Balance Sheet
Balance Sheet is one of the primary financial statements that you can use to monitor the health of your business. It is a picture of your company’s financial position – what you own (assets) and what you owe (liabilities) – at a given point in time.
The Balance Sheet in TallyPrime provides you with a neat snapshot of your business. You can also expand the report for a comprehensive view of your assets (such as cash in the bank, inventory, vehicles, equipment, buildings, and accounts receivable) and liabilities (such as taxes, loans, mortgages, and accounts payable). The difference between what you own and what you owe determines the Net Worth (or Owner’s Equity) of your business.
The Balance Sheet will help you understand the performance of your business. You can also measure the growth of your business by comparing the Balance Sheet of different years. Thus, you will be able take timely decisions for your company. For example, you can easily plan future projects and also meet any unexpected expenses.
The Balance Sheet also proves essential when your business is applying for a loan or investment. Thereby, external entities, such as investors, creditors, and banks, study the Balance Sheet to understand the financial health of a business.
What’s more, you can also view the TallyPrime Balance Sheet in your browser!
View Balance Sheet
The Balance Sheet in TallyPrime will help you monitor the health of your business and also take timely decisions for its growth and betterment.
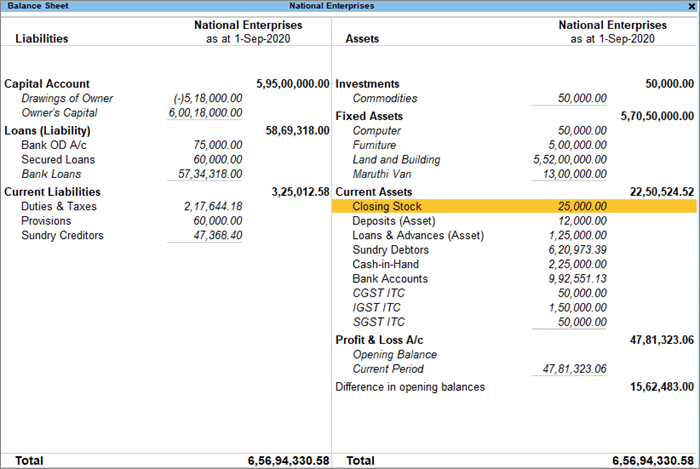
- Gateway of Tally > Balance Sheet. You can see the Liabilities for your company on the left and the Assets on the right.
Alternatively, Alt+G (Go To) > type or select Balance Sheet > press Enter.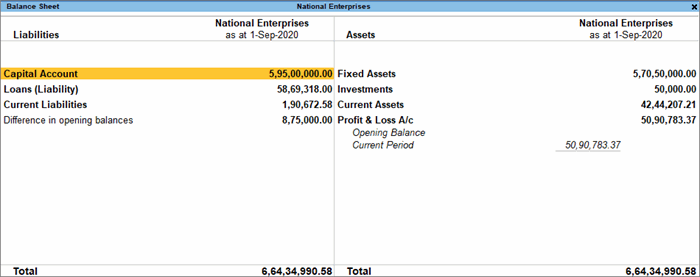
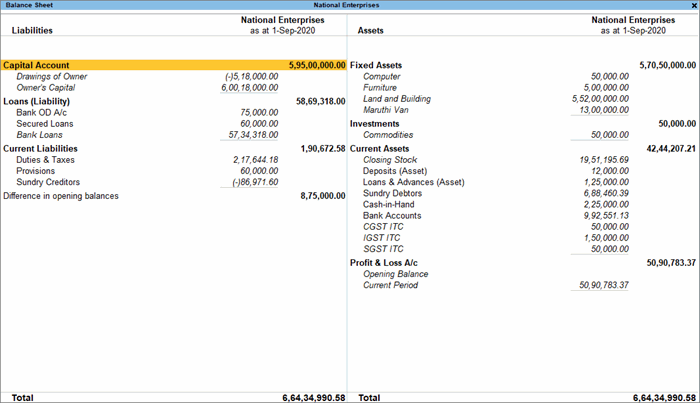
- Press Alt+F5 (Detailed) for a comprehensive view of the Balance Sheet. You can see the details of your assets (such as cash in the bank, inventory, vehicles, equipment, buildings, and accounts receivable) and liabilities (such as taxes, loans, mortgages, and accounts payable).
If you have a group company in TallyPrime, you can use the Balance Sheet to view the consolidated financial data and measure the overall performance of your business. Refer to the article Group Company in TallyPrime for more details.
Sources and Application of Funds | Vertical Balance Sheet
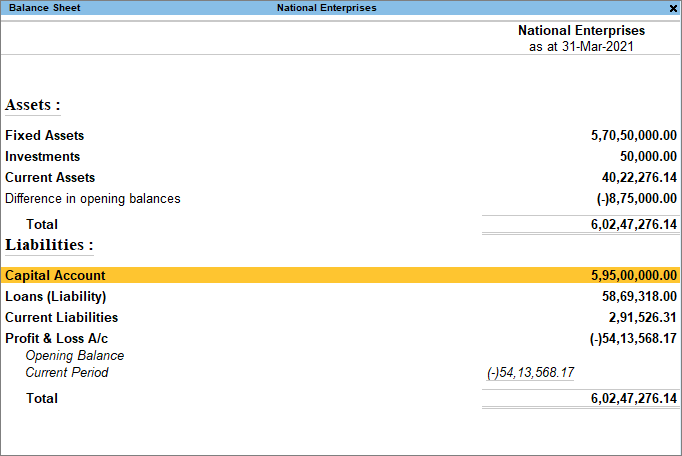
The vertical Balance Sheet is a new format of the Balance Sheet, wherein you can view the Liabilities (under Sources of Funds) on the top and the Assets (under Application of Funds) on the bottom. All the details will be captured in a single column. Using the vertical Balance Sheet, you can easily compare the information on the Balance Sheet for a single period. For example, you can compare the current assets to the current liabilities to estimate the liquidity of the business as on a given date.
The Liabilities in the Balance Sheet correspond to the Sources of Funds and the Assets correspond to the Application of Funds. Thus, the vertical Balance Sheet will also help you understand how your company has sourced its funds and how it has utilised them.
- Balance Sheet > F12 > set Show Vertical Balance Sheet to Yes.
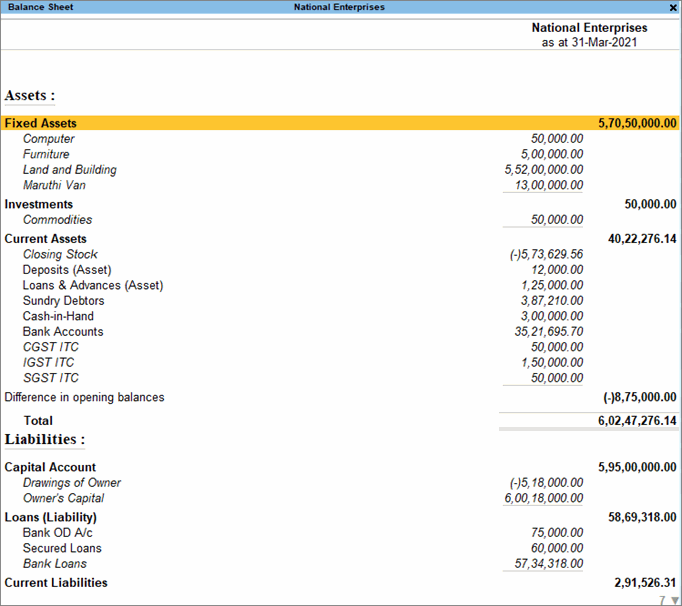
You can view the Liabilities (under Sources of Funds) on the top and the Assets (under Application of Funds) on the bottom. If you want to see the Assets on the top and the Liabilities on the bottom, then press F12 (Configure) > Method of Showing Balance Sheet > Source/Application. - Press Alt+F5 (Detailed) for a comprehensive view of the vertical Balance Sheet. You can see the details of your assets (such as cash in the bank, inventory, vehicles, equipment, buildings, and accounts receivable) and liabilities (such as taxes, loans, mortgages, and accounts payable).
You can use this information to assess if funds are flowing smoothly to the appropriate areas of your business, or if you need to change the way in which your company receives funding.
Set Closing Stock
In TallyPrime, the Closing Stock displayed in the Balance Sheet is based on the Costing Method defined for each stock item. According to the general principle of accounting, the stock will be valued at the purchase cost or at the market price, whichever is lower.
In TallyPrime, you can manually set the value of the Closing Stock. Consider that the market value of the stock on 31-12-2019 is Rs 25,000. To set this amount as the Closing Stock:
- Press F11 (Features) > set Integrate Accounts and Inventory to No.
- Create a ledger stock item under Stock-in-Hand.
- Set the Opening Balance as Rs 25,000, and accept.
Now when you go back to the Balance Sheet, you can see that the Closing Stock is set at Rs 25,000.
When the balances are carried forward to the next year, the opening value of the stock will be Rs 25,000.
Compare Information
You can use the Balance Sheet as a powerful medium for comparison. You can compare financial information across companies, time periods, valuation methods, and so on. By comparing time periods, you can easily measure the growth rate, pattern of expenses, and so on. You can choose different time periods such as daily, weekly, monthly, quarterly, and so on.
Similarly, if you want to view the Balance Sheet for two or more valuation methods, such as FIFO, LIFO, Average Cost, Average Price, and so on, then you can easily view them in separate columns in the same Balance Sheet.
- Balance Sheet > Alt+N (Auto Column).
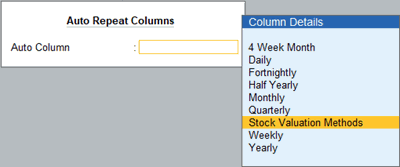
- Select Stock Valuation Methods in the Auto Column field.

Now you can view the information in the Balance Sheet according to the methods of stock evaluation, and compare the components that interest you. Press the right arrow key to view all the valuation methods.
Change the Order of Groups
You can change the order of the group heads in the Balance Sheet as per your requirements. For example, you may want to place the Investments group above Fixed Assets in the Balance Sheet.
- In the Balance Sheet, select the required group, which is Investments in this case.

- Press Ctrl+Enter to open the Group Alteration screen.

- Press Ctrl+I (More Details) > Show More > Position Index in Reports. You can see that the position index of the Investments group is 50.
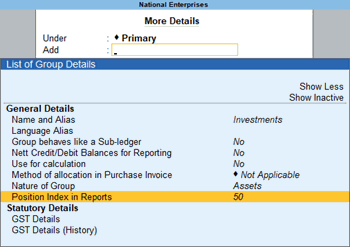
Similarly, note the Position Index for the Fixed Assets group. You can see that the position index of the Investments group is 40.
- Increase the Position Index for the Fixed Assets group, and decrease the position index of the Investments group. For example, you can enter the new Position Index for Investments as 40 and for Fixed Assets as 50. Enter the required Position Index.
- Save the details, and return to the Balance Sheet.

Now you can see that the Investments group appears above Fixed Assets in the Balance Sheet.